Bar gauge panel
The bar gauge simplifies your data by reducing every field to a single value. You choose how SmartCollect SC² calculates the reduction.
This panel can show one or more bar gauges depending on how many series, rows, or columns your query returns.
Bar gauge visualizations allow you to apply:
Use the following options to refine your visualization:
- Show - Choose how SmartCollect SC² displays your data.
- Calculate - Show a calculated value based on all rows. For a list of available calculations, refer to List of calculations.
- All values - Show a separate stat for every row. If you select this option, then you can also select a Limit, or the maximum number of rows to display.
- Value - Select a reducer function that SmartCollect SC² will use to reduce many fields to a single value. Click the Value list to see functions and brief descriptions.
- Orientation - Choose a stacking direction.
- Auto - SmartCollect SC² selects what it thinks is the best orientation.
- Horizontal - Bars stretch horizontally, left to right.
- Vertical - Bars stretch vertically, top to bottom.
- Display mode - Choose a display mode.
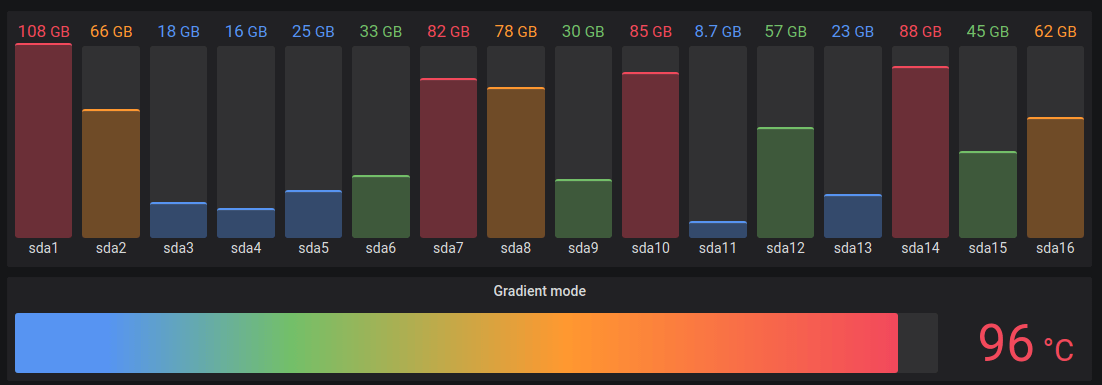
- Gradient - Threshold levels define a gradient.
- Retro LCD - The gauge is split into small cells that are lit or unlit.
- Basic - Single color based on the matching threshold.
- Show unfilled area - Select this if you want to render the unfilled region of the bars as dark gray. Not applicable to Retro LCD display mode.